Infographic explaining a forecasting service

  • Status: Closed
  • Prize: $150
  • Entries Received: 116
  • Winner: W3WEBHELP

Contest Brief

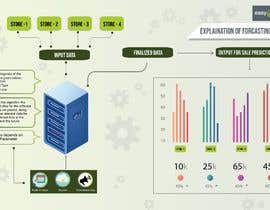
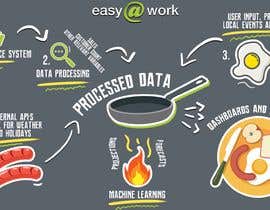
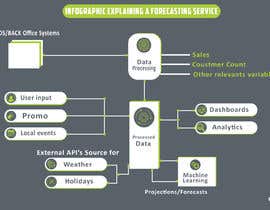
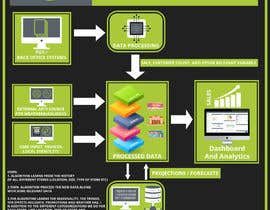
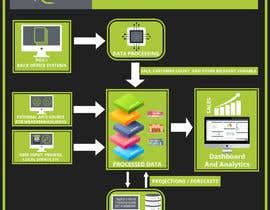
We have a service that projects sales across a number of categories. E.g sales, number of customers, number of a specific product sold etc.

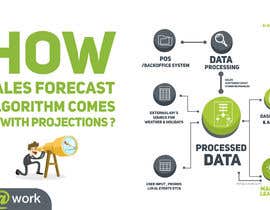
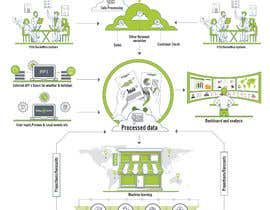
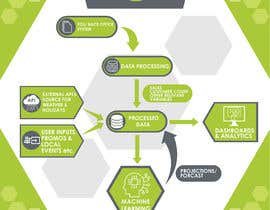
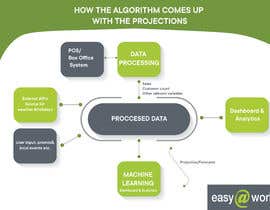
We want an infographic that can explain to a non-technical user how the algorithm comes up with the projections.

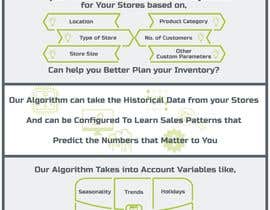
This is for chains, with several different stores, so the algorithm learns from the history of all different stores, and also based on configuration, learns the patterns of different types of stores, like location, size, type of store etc.

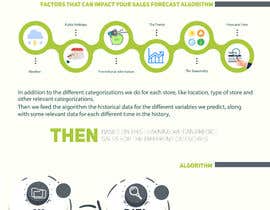
Then we feed the algorithm the historical data for the different variables we predict, along with some relevant data for each different time in the history, and the future:

Public holidays
Weather (precipitation, cloud coverage etc)
Promotional information (whether or not there is a national promotion for a specific product or product group)

The algorithm learns the seasonality, the trends, the effects holidays, promotions and weather has, in addition to the different categorizations we do for each store, like location, type of store and other relevant categorizations.

Then based on this learning we can predict sales for the different categories.

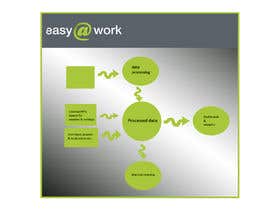
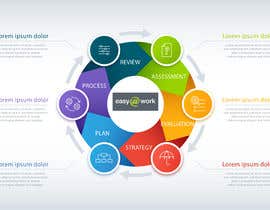
We want a graphic representation of this flow, to easier explain to non-technical end users how the process works, and how the algorithm comes up with the predictions it does.

Any text should be in US English.

If you have any questions, or need any more information, let us know, and we will try to give quick responses.

Our company logo and colors are attached.

Update 10:35 UTC+2: Added a quick sketch of what we think could be one way to go.

Recommended Skills

Employer Feedback

“@W3WEBHELP won the contest on 22 October 2020”

Profile image landsem, Norway.

Public Clarification Board

  • shiblee10
    shiblee10
    • 3 years ago

    #91 #92

    • 3 years ago
  • shiblee10
    shiblee10
    • 3 years ago

    please check #91 #92

    • 3 years ago
  • shiblee10
    shiblee10
    • 3 years ago

    please check #91 #92 , clearly infographic explain

    • 3 years ago
  • Noury7
    Noury7
    • 3 years ago

    Kindly check #90

    • 3 years ago
  • Kushigrafix
    Kushigrafix
    • 3 years ago

    Sir , Can you have a look at #146 .. i think you will like it

    • 3 years ago
  • iwork93
    iwork93
    • 3 years ago

    #extended

    • 3 years ago
  • iwork93
    iwork93
    • 3 years ago

    you want idea.jpg to be converted in infographic style or the text you wrote to be in an infographic style?

    • 3 years ago
  • MrAIO
    MrAIO
    • 3 years ago

    sir could you please tell us about your target audience?

    • 3 years ago
  • MiralSZ
    MiralSZ
    • 3 years ago

    #47

    • 3 years ago
  • staslvov
    staslvov
    • 3 years ago

    Hello, I have some questions, can you write me pls?

    • 3 years ago
    1. landsem
      Contest Holder
      • 3 years ago

      Shoot

      • 3 years ago
  • rbstudio57
    rbstudio57
    • 3 years ago

    Sir I have some questions can you come into inbox?

    • 3 years ago
    1. landsem
      Contest Holder
      • 3 years ago

      Go ahead

      • 3 years ago
  • rbstudio57
    rbstudio57
    • 3 years ago

    Hi Sir,

    • 3 years ago
  • mshahanbd
    mshahanbd
    • 3 years ago

    2314651

    • 3 years ago
  • aleemnaeem
    aleemnaeem
    • 3 years ago

    #extended

    • 3 years ago

Show more comments

How to get started with contests

  • Post your contest

    Post Your Contest Quick and easy

  • Get tons of entries

    Get Tons of Entries From around the world

  • Award the best entry

    Award the best entry Download the files - Easy!

Post a Contest Now or Join us Today!