CGraphixo
Pakistan


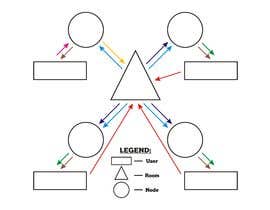
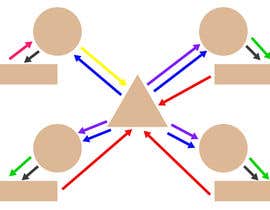
I am looking for someone to turn a hand drawn flowchart diagram I made into a beautiful digital asset. The most important aspects about this chart are the lines that are the same color represent an action that happens at the same time and the black shapes indicate a particular type of object (either a user, room, or node). You'll notice that the colors are also numbered, this is to indicate that these actions happen in that particular order.
I am not against someone getting creative (I actually prefer creative ways of interpreting these types of things), the only restrictions is the number of actions must be 7 and happen in the order that you see with 4 Nodes, 4 users, and 1 room. How you choose to represent this is up to you. We will also need the ledgend, but not the actoin order (put that in there for you) included in the graphic.
Thank you in advance!
“Dan heeded the call to be creative and was able to better illustrate our objective graphically than we could've imagined doing. He was quick to respond and very helpful with edits we asked for and returned on them in minutes. Great experience. Highly recommended.”
![]() brandonjpscott, United States.
brandonjpscott, United States.


Post Your Contest Quick and easy

Get Tons of Entries From around the world

Award the best entry Download the files - Easy!