MattChojnacki
Poland

Hello Excel Experts Community,
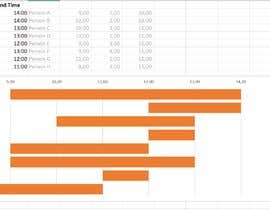
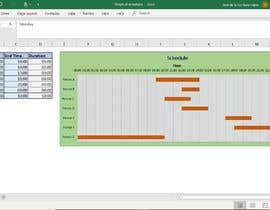
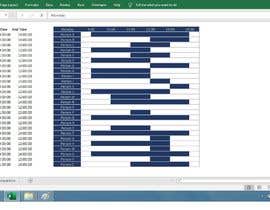
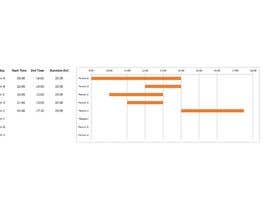
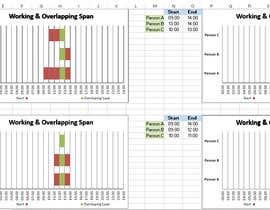
Please open the Excel attachment. Could you then help me to choose a chart that will display the overlaps in duration between Person A, B and C; preferably displaying time on the horizontal x-axis (starting from 9:00 AM and ending at 2:00 PM) and with a separate bar for each person on the vertical y-axis - ideally in the shape of a "diverging bar chart" or similar?
I'm trying to schedule a meeting between these three people and visualise the overlaps in availability between them - if you help me, I'll be able to create a graph or chart (or similar) for even more people!
Thank you so much for looking into this issue and providing this great service!
All the best,
Susanne Beaumont
NB: Please Upload your Solution in the form of an Excel spreadsheet.


Post Your Contest Quick and easy

Get Tons of Entries From around the world

Award the best entry Download the files - Easy!